Payment analytics
What is approved, what is declined, and why.
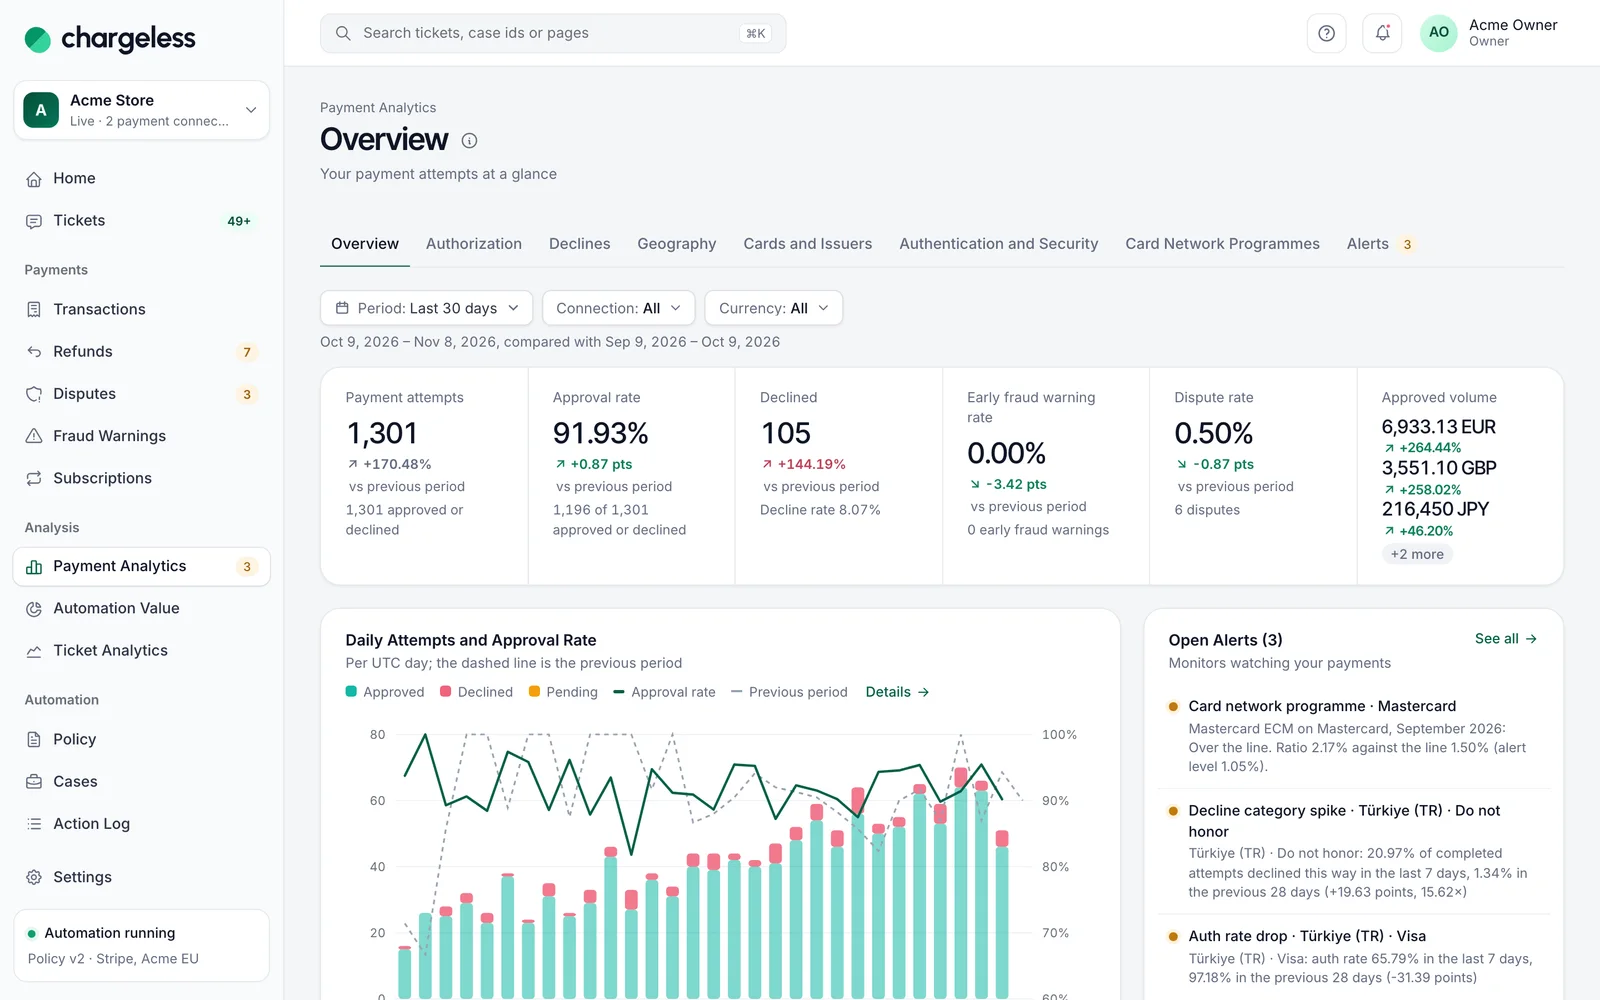
Two numbers to start: the share of card attempts approved, and why the rest were declined. Both against the previous period.
The approval rate, against the previous period
Approved out of completed attempts, so unfinished checkouts don’t drag it down. Every figure is compared with the previous period of the same length: 92% to 89% reads as −3 points.
- Pending attempts left out
- Previous period, side by side
- Filter by connection and currency
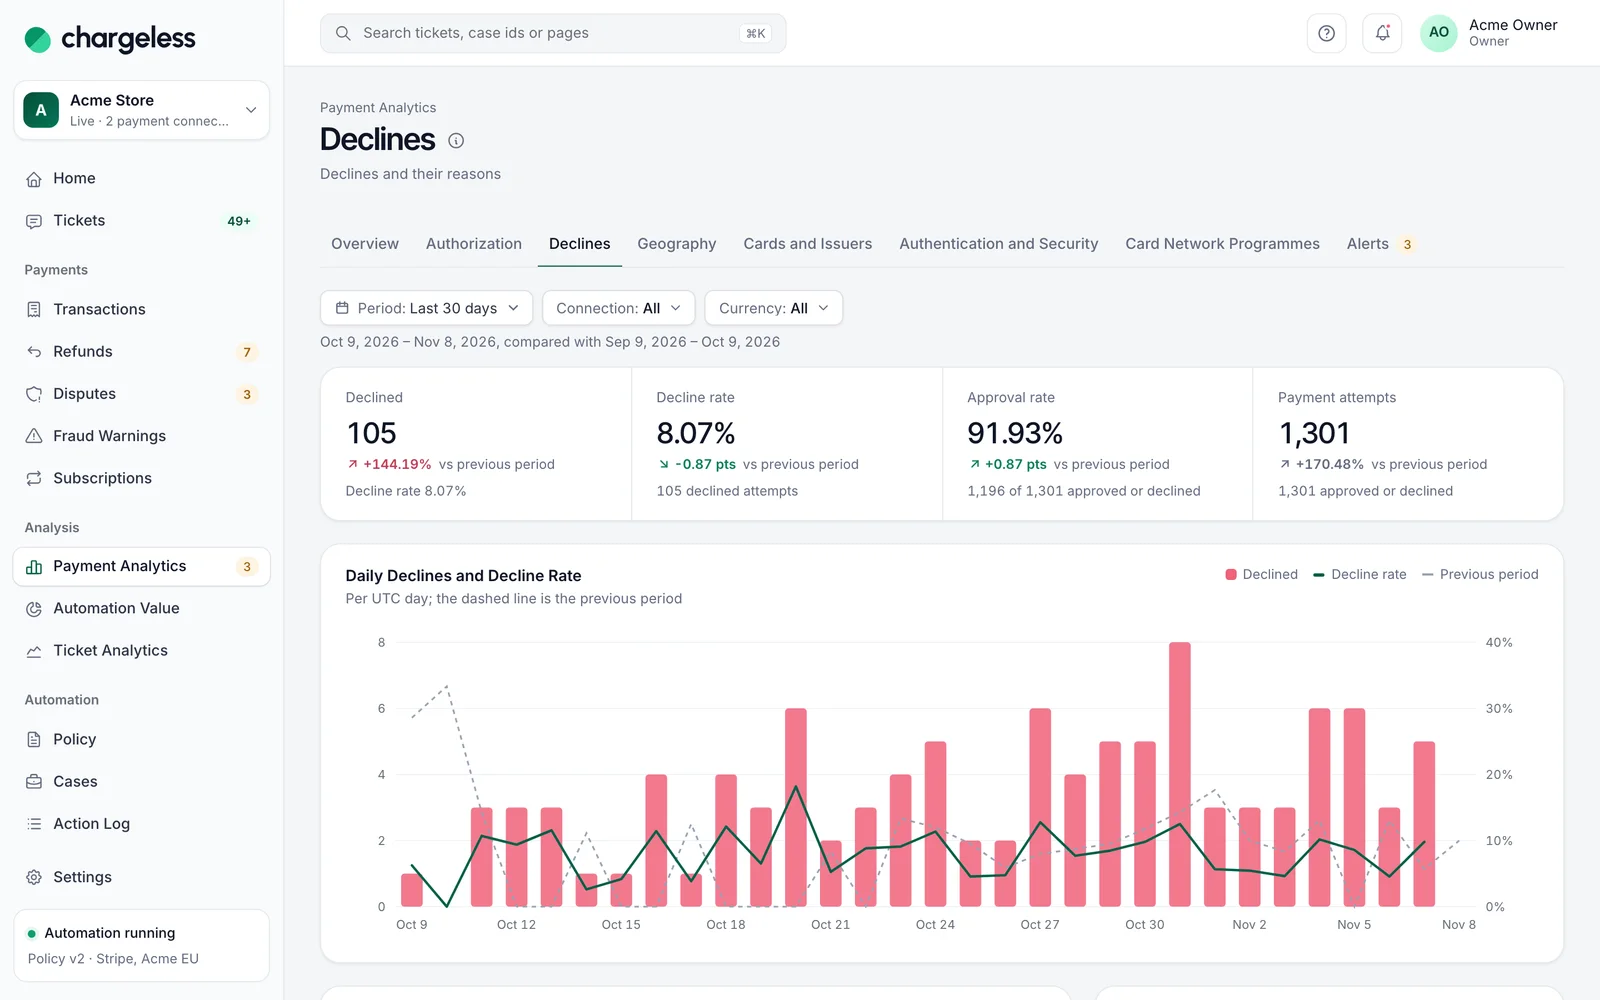
Decline categories that say what went wrong
Every decline is sorted by your provider’s code into one of twelve categories, from insufficient funds to suspected fraud. A category whose share jumps points at its cause.
- Twelve decline categories
- Each share and its change
- Previous period as a dashed line
Click a row, and every report follows
Press Türkiye, Visa or Do not honor, and every report and the attempt list follow. Filters combine, and the link keeps them.
- Filters across every report
- Down to single attempts
- A shareable link per view
Declines by reason
Türkiye ×Visa ×
More in Payment analytics
Start with low limits. Raise them when the record shows it works.
Start in test mode, run your policy against your own history, and go live when the results meet your standards.
- 1A test workspace on your provider’s test mode
- 2Your past requests replayed against your policy
- 3Live with low limits, raised as the record allows